


You should spend about 20 minutes on this task.
The graph below shows the changes in the maximum number of Asian elephants between 1994 and 2007.
Summarise the information by selecting and reporting the main features, and make comparisons where relevant.
Write at least 150 words.

Model Essay
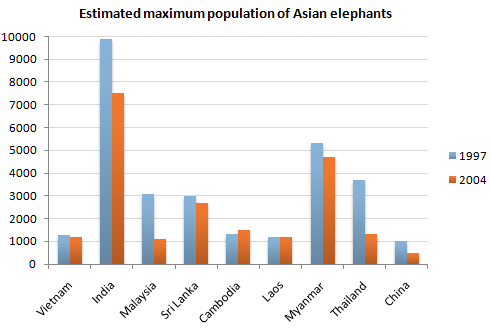
The graph shows the estimated maximum population of elephants in a range of Asian countries in both 1997 and 2004.
In most of the countries included in the graph, the population fell. This was most noticeable in Malaysia and Thailand, where the number of elephants was thought to be less than half the figure in 1997. In the former, the number of elephants dropped as low as 1000. India remained the country with by far the largest elephant population, but experienced a dramatic fall in numbers so that in 2004 there may have been as few as 7500. Despite its size, China had a very small population of at most 500 elephants by 2004.
Although the trend was downwards overall, elephant populations were thought to have remained stable in Laos and Vietnam at approximately 1200. The only country where elephants showed signs of recovering was Cambodia, where numbers may have risen by up to 200.
Source: IELTS Material


