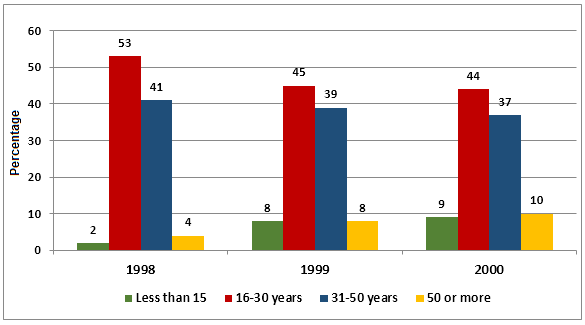
The graph shows Internet Usage in Taiwan by Age Group, 1998-2000.
Summarise the information by selecting and reporting the main features, and make comparisons where relevant.
» You should write at least 150 words.
Who Uses the Internet in Taiwan?

Sample Answer 1:
The bar graph outlines the percentage of internet users in Taiwan based on their age groups between 1998 and 2000. As is presented in the bar graph, the ratio of Taiwanese internet users between 16 and 30 years was higher than that of other age groups and over the time, internet users’ ratio from younger and aged people increased.
According to the given data, in 1998 more than 50% internet users in Taiwan were between 16 and 30 years old. People from 31 to 50 years old were 41% of total internet users. Very fewer people over 50 years old or less than 15 years used the internet in Taiwan in this year.
Next year, the proportion of younger and aged internet subscribers increased to 8% and internet users from other two age groups decreased slightly. In 2000, the same trend can be observed and senior internet users expanded to 10% while the percentage of internet users among 16 to 50 years reduced by 1-2%.
As is observed from the bar graph, the internet was popular among the 16 to 50 years old people in Taiwan and over times the younger and senior citizens’ affection and needs towards internet usages extended.
Model Answer 2:
The column graph delineates the ratio of Taiwanese internet users based on their ages from the year 1998 to 2000. As is obvious, the majority of the internet users in Taiwan were between 16 and 50 years old during the given period.
According to the bar chart, more than half of the Taiwanese internet users in 1998 were young people, between 16 and 30 years old, while another 40% were from 31-50 age group. The remaining 6% were either minors or senior citizens.
After a year, more minors and old people in Taiwan embraced this technology as their ratio went as high as 8%. This increase slightly affected the younger internet users’ ratio as their percentages dipped.
Next year, in 2000, minor internet users boosted to 9%, a percent fewer than the old internet users over 49 years old. In this year, 16-30 years internet users comprised 44% of the total while 31-50-year-old contributed to another 37% of total internet users in Taiwan.
Sample Answer 3:
The column graph depicts the proportion of Taiwanese internet users categorising them in four different age groups between 1998 and 2000. Generally speaking, young Taiwanese internet users were significantly higher than the internet users from other age groups.
In 1998, 53% of the total Taiwanese internet users were between 16 and 30 years old. This figure was significantly higher, by 12% than those aged 31-50 years old. Internet usage in minors and those over 50 years old were less than 5%.
Next year, the percentage of internet users dropped by 2-8%, except for those less than 15 years old. Their rate raised by fourfold and for those over 50 years old, doubled. In 2000, the figures for age groups 16-30 and 31-50 went down slightly by 1-2%, whereas it increased at the same rate for those aged less than 15 and over 50.
Based on the information given, it can be deduced that the proportion of age groups using the internet in Taiwan minimally changed in a span of 3 years. It is also noticeable that while internet usage in teens and adults dropped slightly, the figures for both children and elders grew by almost twofold.
[Written by – Rose]
Sample Answer 4:
The bar chart illustrates the percentages of internet users in Taiwan in three different age groups between 1998 and 2000. Overall, young internet users in Taiwan was remarkably higher than older internet users.
It is clear that the highest internet user was the young age group (between 16 and 30 years), though the rate had decreased over the period, while the lowest was the junior population (aged below 15). In 1998, the highest population of internet users in Taiwan was the young people, as their figure was accounted for 53% of the total internet users. It dropped drastically to 44% in 2000. As for the middle age people (between 31 and 50 years), their figure had decreased slightly from 41% in 1998 to 37% in 2000.
The senior people (aged 50 years and above) and the junior people figures’ were 4% and 2% 1998. As the senior people’s percentage grew by two-fold, the junior group rate also increased by 6% in 1999. And then both figures continued to increase as they reached 10% and 9% in 2000.
(Written by – Darwin Lesmana)


