


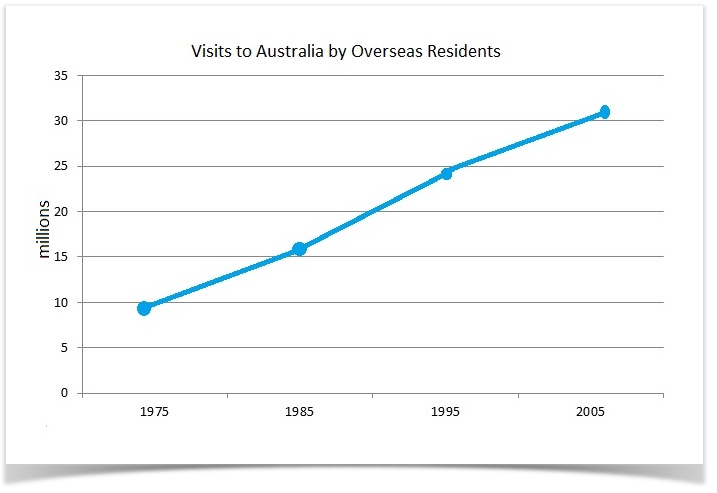
The line graph below shows the number of annual visits to Australia by overseas residents. The table below gives information on the country of origin where the visitors came from.
Write a report for a university lecturer describing the information given.
You should write at least 150 words.
Number of Visitors (million)
| 1975 | 2005 | |
| SOUTH KOREA JAPAN CHINA USA BRITAIN EUROPE |
2.9 3.2 0.3 0.4 0.9 1.1 |
9.1 12.0 0.8 1.1 2.9 4.5 |
| Total | 8.8 | 30.4 |
Sample Answer 1:
The provided line graph delineates data on the changes of visitors’ number to Australia from 1975 until 2005 while the table elaborates the percentage of tourists from various countries. At the onset, the number of foreign travellers to Australia had surged ceaselessly during the whole period and tripled by 2005. Moreover, the most substantial growth in the number of foreigners attended Australia had shown by Japan, South Korea and Europe.
The line graph shows that visit to Australia by non-residents had overwhelmingly moved upward over the period of 2 decades: it was nearly 10 million in 1975 and slightly more than 30 million in 2005. Throughout the period, the number of tourists went up as high as 5 million each decade; however, between 1985 and 1995 it boomed to almost 10 million.
While taking into consideration the table data we can easily infer that South Korea, Japan and Europe were leading sources of tourists (2.9, 3.2 and 1.1 million respectively) to Australia. In the wake of 3 decades, those figures almost quadrupled to 9.1, 12. and 4.5 million consecutively. Other countries represented less dramatic increase: China – from 0.3 to 0.8 million, the USA – from 0.4 to 1.1 million and the UK – from 0.9 to 2.9 million. It is worth noticing that the most significant growth in the number of travellers to Australia was from Japan, South Korea and Europe. Australia received the highest number of tourists from these countries during the period.
[Written by – Sukhayl]
Model Answer 2:
This line graph presents the number of visits to Australia by foreign citizens per year while the table specifies the visits per country that took place in the year 1975 and 2005. There has been a gradual increase from 1975 to 1985 while the number doubled from 1984 to 1995 as seen on the chart. However, compared to 1975, in 2005 the number of foreign visitors has increased drastically (Total 8.8 in 1975; 30.4 in 2005).
Furthermore, an interesting fact is that among the six countries given, South Korea and Japan had the most number of foreign visitors to Australia in 2005 compared to 1975 (South Korea: 2.9 in 1975 and 9.1 in 2005; Japan: 3.2 in 1975 and 12.0 in 2005). Meanwhile, China having had 0.3 million people visiting Australia in 1975 but 0.8 million in 2005 which is quite less in terms of changes that took place over the years compared to other countries over the past years.
Overall, compared to 1975 the number of foreign visitors has been increasing, reaching quite a high number of visitors of 32 million to Australia while having a majority of visitors from South Korea and Japan. On the other hand, the least number of travels was from China but it is safe to say that the majority of the visits to Australia were from Asian countries than Western countries.
[Written by – Menu Anju ]
Sample Answer 3:
The given line graph and table give data on the number of overseas visitors travelling to Australia in millions of people from the year 1975 to 2005 and shows the number of travellers from 6 different parts of the world.
As is presented in the illustration, the number of visitors travelling to Australia raised steadily and the majority of these visitors came from Japan, South Korea and Europe. Almost 10 million people visited Australia in the year 1975 and this amount increased to over 15 million after 10 years. In the year 1995, total visitor travelled Australia was approximately 24 million and finally in 2005 well over 30 million.
The second table gives data on the number of visitors from 6 different regions who came to visit Australia in 2 different years with a 30 years interval. Both in 1975 and in 2005, Australia had the largest number of Japanese tourists followed by South Korea. In 2005, tourists from these 2 countries who came to visit Australia were about 20 million while 4.5 million tourists came from Europe and only 1.1 million from the USA. The least number of tourists came to Australia during this period are from China which was only 0.3 million in 1975 and 0.8 million in 2005. The statistics of the table shows that total tourist visited Australia from 6 different parts of the world increased significantly in 300 years amounting well over 30 million in 12005 compared to the total number of 8.8 million 30 years earlier.
(Approximately 250 words)
(This model answer can be followed as an example of a very good answer. However, please note that this is just one example out of many possible approaches.)
Alternative Answer 4:
The provided graphs and the table show data on the number of overseas travellers visited Australia from the year 1975 till 2005 and their origin where they came from. As is observed in the line graph, in 1975 8.8 million of foreign travellers visited Australia and this number increased steadily each year. In 2005, this visitor’s number reached to 30.4 million which is almost double than the visitors’ number in 1985.
The highest number of tourists came from Japan. In 1975, more than 3 million tourists came from Japan which is more than the total tourists came from Europe, Britain, China and USA. This number reached to 12 million in 2005 which contributed one-third of the total tourist of this year. The second largest tourists came to Australia from South Korea both in 1975 and in 2005. The Chinese tourist is the lowest in number among the 6 regions.
In short, the number of total tourists who came to visit Australia increased steadily and the highest number of tourist came from Asia, specifically from Japan and South Korea.
(Approximately 177 words)
Sample Answer 5:
The given line graph and table give data on the number of foreign travellers who visited Australia from the year 1975 to 2005 and shows where they came from. As is observed from the given illustrations, the number of overseas visitors increased steadily each year and the highest number of tourists came to Australia from Japan and South Korea.
As is presented in the given line graph, around 9 million tourists came to Australia initially in 1975. This number kept on increasing steadily and reached over 15 million in 1985. In the year the number of tourists who visited Australia reached to 24 million and finally in 1995, this number rocketed to well over 30 million. The number increased each year starting from 1975 and in 30 years, the total tourists’ number got well over 30 million.
The table then compares the foreign tourists who visited Australia in 1975 and 2005 and shows the origins of these tourists. In 1975, total 8.8 millions of tourists visited Australia and among them, 2.9 million came from South Korea and 3.2 million from Japan. The remaining travellers came from China, USA, Britain and Europe. After 30 years in 2005, the total Australia visiting tourists increased to 30.4 million compared to the 8.8 million in 30 years back. 9.1 millions of South Korean tourists came to visit Australia in 2005 and this number is more than 3 times compared to tourists number of 1975. In 2005 the Japanese tourists’ number increased to almost four times than the tourists’ number of 1975. The tourists’ number increased for all the given six countries in 2005 than the tourists of 1975. The majority of the tourists came to visit Australia from Asia than the USA and Europe. In 2005, around 22 millions of tourists came to Australia from Asian countries compared to the remaining 8.5 millions of tourists from Britain, the USA and Europe.
Model Answer 6:
The given line graph illustrates the annual visits to Australia by foreigners in million from the year 1975 to 2005 while the table represents these visits from six different countries in both 1975 and 2005. A staggering increase in the number of visits to Australia is noticeable. A large portion of this increase can be attributed to South Koreans and Japanese tourists as is evident in the table data.
An upward moving trend is clearly visible in the line graph that shows an increase in visits to Australia by foreigners as the number rose from 8.8 million in 1975 to 30.2 million in 2005, almost trebling in value in the period spanning from 1975 to 2000.
This spike in numbers can be largely attributed to South Koreans and Japanese tourists as their tourism rose a whopping 15 million collectively. This trend was not seen in the United States, China, or Britain as their tourists’ numbers who visited Australia did not increase significantly (1.1, 0.8 and 2.9 respectively in 2005). European tourism, however, also saw a rise in appetite towards Australia their tourism almost quadrupled from 1975 to 2005.
(Approximately 188 words | Written by Madu Sane)


